31 October 1999
Source: Hardcopy from the National Security Agency received October 21, 1999.
Released in response to an FOIA
request dated May 18, 1998. Of twenty-two TEMPEST-related documents
requested, only parts of two were released.
NSA wrote that most remain
classified as SECRET and unreleasable. An
appeal for additional
releases has been filed.
This a fifth and final part of transcription of a 172-page document in which
classified sections, about half of the volume, have been redacted (indicated
by xxxxxxxx).
First part of transcription, Appendix A:
nstissam1-92a.htm
Second part, Table of Contents and Sections 1-5:
nt1-92-1-5.htm
Third part, Sections 6-12:
nt1-92-6-12.htm
Fourth part, Distribution List:
nt1-92-dist.htm
The other release, NSA/CSS Regulation 90-6, Technical Security Program,
a 12-page document:
nsa-reg90-6.htm
Classification symbols: (U) = unclassified, (C) = classified, FOUO = for
official use only. Overstrikes in the original.
For comprehensive TEMPEST stuff (non-secret, that is) see The Complete,
Unofficial TEMPEST Information Page:
http://www.eskimo.com/~joelm/tempest.html
From Table of Contents
APPENDICES
A. CLASSIFICATION OF COMPROMISING
EMANATIONS INFORMATION (Separate file)
A.1 General
A.2 Scope
A.3 Rationale
A.4 Classification Marking
A.5 Foreign Release
A.6 Specific Guidelines
A.7 TEMPEST Classification Chart Outline
A.8 TEMPEST Classification Chart
B. DESCRIPTION OF CORRELATED SIGNALS
C. TEST GUIDELINES FOR PARALLEL INFORMATION TRANSFER
EQUIPMENT
C.1 Purpose
C.2 Parallel Transfer Example
C.3 Types of Parallel Information Transfer
C.3.1 Return-to-Zero Signals
C.3.2 Nonreturn-to-Zero Signals
C.3.3 Polygraphic and Multiplexed Signals
C.4 Test Patterns
C.4.1 Type A Test Patterns
C.4.2 Type B Test Patterns
C.4.3 Type C Test Patterns
C.5 Emanation Measurement Procedures
C.6 Evaluation of Results
C.6.1 Bit Density
C.6.2 The Effect of Parity Check Bits
C.7 Effect of Multiple Signals
D. ALPHANUMERIC CRT DISPLAYS
D.1 Scope
D.2 Introduction
D.3 Examples of Scanning and Character Generation Methods
D.3.1 Scanning
D.3.2 Character Generation
D.4 Examples of Defining Rd
D.4.1 Standard TV Display -- Continuous Scan
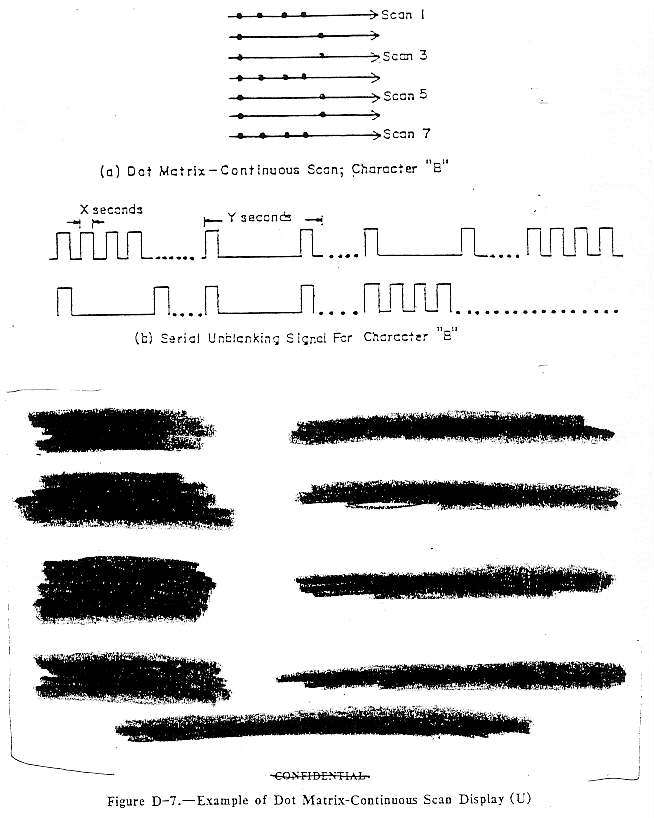
D.4.2 Dot Matrix -- Continuous Scan
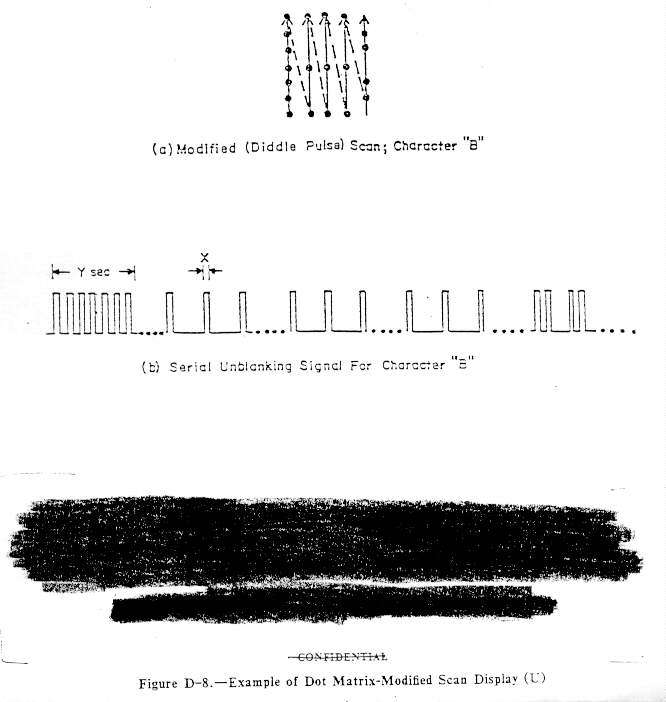
D.4.3 Dot Matrix -- Modified Continuous Scan
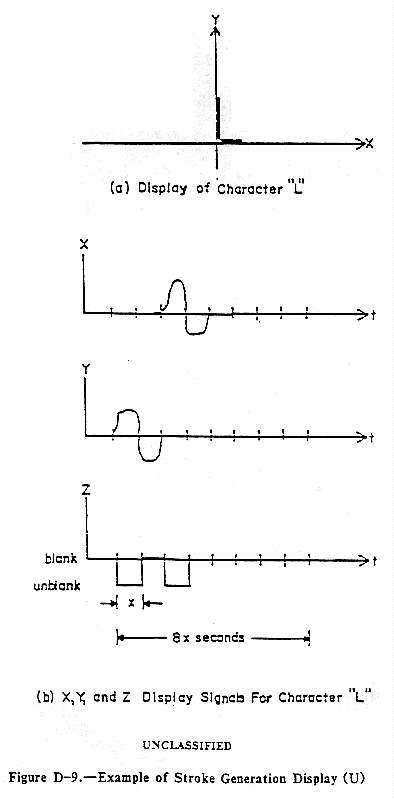
D.4.4 Stroke or Vector Generation
D.5 Special Test Requirements
D.5.1 Alphanumeric CRT Displays
D.5.2 Bit Mapped Displays
E. AUTOMATED TESTING SYSTEMS CERTIFICATION
REQUIREMENTS
E.1 Purpose
E.1.2 [sic] Supplementary Manual Test
E.1.3 General Approach
E.1.4 System Certification Philosophy
E.1.5 Alternative Approaches
E.2 Automated Test Procedures
E.2.1 General
E.2.2 Tuning Scheme
E.2.3 Measurement Accuracy
E.2.4 Digital Voltmeter
E.2.5 Measurement Gate Time
E.2.6 Substitution Sources
E.3 Advance Certification Testing Requirements
E.3.1 Rd-Type Signal Certification Tests
E.3.2 Rd-Type Signal Certification Tests
E.4 Periodic Calibration Verification Requirements
E.4.1 Internal Attentuator Calibration Verification
E.4.2 Internal Source Verification
E.5 Scan Accuracy Verification Requirement
E.6 Automated Detection Systems Using A Spectrum Analyzer
E.6.1 Implementation
E.6.2 Automated Testing Procedures Using A Spectrum Analyzer
E.6.3 Advance Certification Testing Requirements
E.6.4 Rt-Type Signal Certification Tests
E.7 Critical Feature List Requirements
E.7.1 Critical Features List
E.8 Documentation Requirements
E.8.1 Test Instrument Certification
E.8.2 Test Plan Additions
E.8.3 Data Collection and Reporting
E.9 Security
F. DETECTION SYSTEM BANDWIDTH MEASUREMENT
F.1 Introduction
F.2 6 dB Bandwidth Measurements: Tunable Heterodyne Detection System With
Demodulator
F.2.1 Signal Generator Requirements
F.2.2 Measurement Procedure
F.3 6 dB Bandwidth Measurements: Tunable Heterodyne or Tunable Non-Heterodyne
Detection System Without Demodulator
F.4 6 dB Bandwidth Measurements: Non-tunable Detection Systems
F.5 Impulse Bandwidth Measurements (IBW): Tunable Heterodyne Detection System
With Demodulator
F.6 Impulse Bandwidth. Measurements: Tunable Heterodyne or Tunable Non-Heterodyne
Detection System Without Demodulator
F.7 Impulse Bandwidth Measurements: Non-tunable Detection Systems
G. TABLES AND FIGURES
H. LEVEL I LIMITS
I. LEVEL II LIMITS
J. LEVEL III LIMITS
K. IMPULSE GENERATOR CALIBRATION
L. TEMPEST TEST PLAN OUTLINE
M. TEMPEST PROFILE
Distribution List (Separate
file)
[Pages B-1 to B-10]
CONFIDENTIAL
DESCRIPTION OF CORRELATED SIGNALS
B.1. (U) The tester has the responsibility to describe clearly and
accurately any correlated signals detected during TEMPEST testing. Table
B-1 depicts the relationship between displayed emanations and types of
correlation. This table is not meant to be all-inclusive. Figures B-1 through
B-8 illustrate some examples of correlated emanations. The upper trace(s)
is the monitor signal (i.e., RED signal) and the bottom trace(s) is the detected
signal. The photographs are representative of onlya few of the possilbe types
of correlation. Also, the photographs depict a high signal-to-noise ratio
to facilitate reproduction and to demonstrate easily recognizable correlation.
Under certain test conditions, the correlation may be far less obvious and
distinct.
Table B-1
ILLUSTRATION OF CORRELATED EMANATIONS (U)
[Table redacted.]
[Figure redacted.]
Figure B-1. -- Examples of Correlated Emanations. A-Scope Display
(U)
[Figure redacted.]
Figure B-2. -- Examples of Correlated Emanations. A-Scope Display
(U)
[Figure redacted.]
Figure B-3. -- Examples of Correlated Emanations. A-Scope Display
(U)
[Figure redacted.]
Figure B-4. -- Examples of Correlated Emanations. A-Scope Display
(U)
[Figure redacted.]
Figure B-5. -- Examples of Correlated Emanations. Raster Display
(U)
[Figure redacted.]
Figure B-6. -- Examples of Correlated Emanations. Raster Display
(U)
[Figure redacted.]
Figure B-7. -- Examples of Correlated Emanations. Raster Display
(U)
[Figure redacted.]
Figure B-8. -- Examples of Correlated Emanations. Raster Display
(U)
CONFIDENTIAL
[Pages C-1 to C-6]
CONFIDENTIAL
TEST GUIDELINES FOR PARALLEL INFORMATION TRANSFER EQUIPMENT
[Figure redacted.]
Figure C-1. -- Parallel Trasnfer of Data (U)
[Figure redacted.]
Figure C-2. -- Bit Density Emanation Examples (U)
[Ten lines redacted.]
___________________
1 NSTISSAM TEMPEST/2-91, "Compromising Emanations Analysis Handbook".
[Footnote to unknown passage.]
[Figure redacted.]
Figure C-3. -- Fingerprint Emanation Examples (U)
[Ten lines redacted.]
[Two full pages redacted.]
[Page C-6] THIS PAGE INTENTIONALLY BLANK
CONFIDENTIAL
[Pages D-1 to D-10]
CONFIDENTIAL
ALPHANUMERIC CRT DISPLAYS
D.1. (U) Scope. -- This appendix describes the operation of alphanumeric
CRT displays and presents guidelines for determining RED signaling rates.
D.2. (U) Introduction.
[Twenty lines redacted.]
D.2.3 (U) The determination of Rt is made in the same manner as described
in 5.5.2.
D.3. (U) Examples of Scanning and Character Generation Methods.
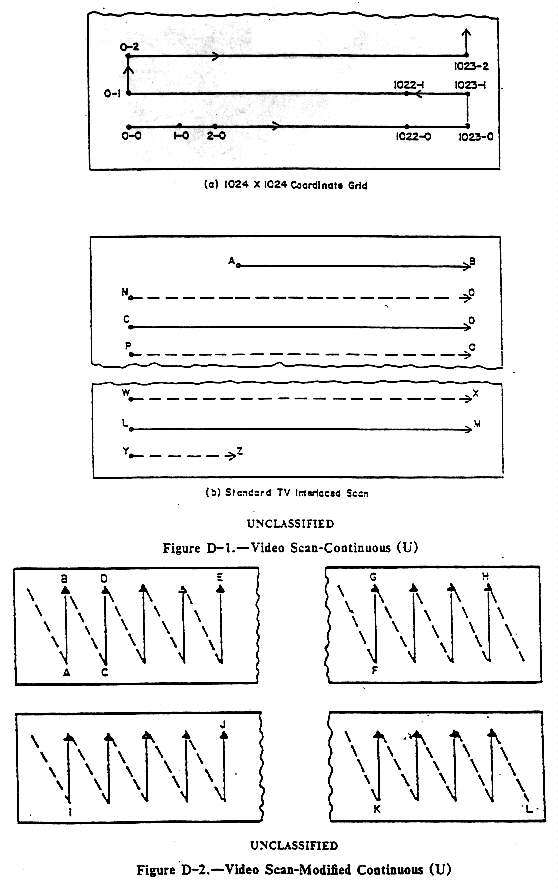
D.3.1 (U) Scanning.
D.3.1.1 (U) Video Scan: Continuous. -- In a continuous scan display, the
electron beam of the CRT starts at a given coordinate point and sequentially
moves through each coordinate point at a fixed sweep speed. This type of
scanning can be extended to other types of CRTs, such as a standard TV monitor
where the scanning is "interlaced" (see Figure D-1).
D.3.1.2 (U) Video Scan: Modified Continuous. -- The electron beam of the
CRT scans all the displayable points for each character of all character
positions. The pattern traced by the defiection system is normally a vertical
modulation of a herizontal sweep. This type of scan uses a sawtooth pattern
sometimes referred to as a "diddle pulse" sawtooth pattern (see Figure D-2).
D.3.1.3 (U) Random Scan. -- In a CRT display with this type of scan, the
beam is not scanned linearly, but is directed from any screen location to
any other.
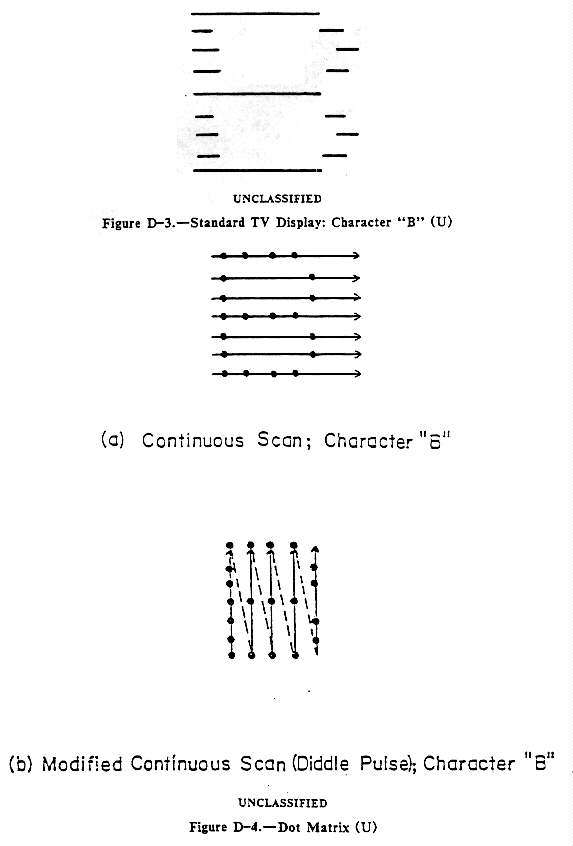
D.3.2 (U) Characrer Generation.
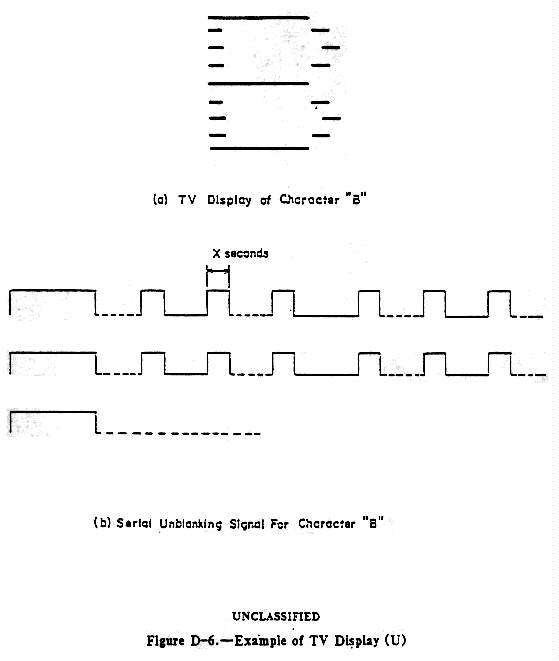
D.3.2.1 (U) Standard TV Display. -- The individual characters are displayed
by unblanking the electron beam during line segments of a continuous scan
(see Figure D-3).
D.3.2.2 (U) Dot Matrix. -- The individual characters are displayed by unblanking
the electron beam at the appropriate positions in a dot matrix (see Figure
D-4).
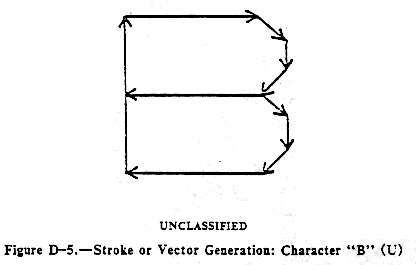
D.3.2.3 (U) Stroke or Vector Generation. -- The individual characters are
displayed by "drawing" small line segments (vectors) to make up the character
(see Figure D-5). The program which is controlling the display must control
the electron beam position, as well as unblanking, since there is no raster.
D.3.2.4 (U) Beam Extrusion. -- The individual characters are displayed by
passing the electron beam through a selected shaped aperture in a metal plate
which causes the beam to assume the shape of the aperture when focused on
the face of the CRO.
D.4. (U) Examples of Defining Rd.
[Fifty lines redacted.]
D.5 (U) Special Test Requirements.
D.5.1 (U) Alphanumeric CRT Displays.
[Full page redacted.]
[Ten lines redacted of a, b, c and d.]
D.5.3 (U) The testing organization shall provide signalling characteristics
used to determine the Rd's and Rt's. Any deviations to the above test
requirements shall be documented and justified.
UNCLASSIFIED
[Pages E-1 to E-6]
UNCLASSIFIED
GUIDELINES FOR AUTOMATED TESTING AND INSTRUMENTATION
E.1 (U) Purpose. -- [Four lines redacted.]
E.1.1 (U) Supplementary Manual Test. -- [Six lines redacted.]
E.1.2 (U) Alternative Approaches. -- [Three lines redacted.]
E.2. (U) Automated Test Procedures.
E.2.1 (U) General. -- [Twelve lines redacted.]
E.2.2 (U) Prescan Calibration Procedures. -- [Four lines redacted.]
E.2.3 (U) Calibration Verification During Testing [Five lines redacted.]
E.3. (U) Automated Detection System Parameters.
[Twenty lines redacted.]
E.4. (U) Documentation Requirements. -- Documentation requirements
for automated testing are indicated below and in Paragraphs 6.3 and 8.4.
[Thirty-two lines redacted.]
[Full page and five lines redacted.]
[Page E-6] THIS PAGE IS INTENTIONALLY BLANK
UNCLASSIFIED
[Pages F-1 to F-4]
UNCLASSIFIED
DETECTION SYSTEM BANDWIDTH MEASUREMENT
F.1. (U) Introduction. -- The overall detection system bandwidth shall
be used when determining compliance of TEMPEST detection systems with the
bandwidth requirements of this document. Procedures are presented for measuring
sine wave and impulse bandwidths of non-tunable detection systems and tunable
detection systems with and without a Demodulator. Alternate procedures rnay
be used, provided the same results are obtained as when using the specified
procedures herein. The alternate procedures used must be documented in the
test instrumentation certification report and must be approved by the sponsoring
organization.
F.2. (U) 6 dB Bandwidth Measurements: Tunable Heterodyne Detection System
with Demodulator. -- This procedure is required for deterlIiining the
overall 6 dB detection system bandwidth of tunable heterodyne detection systems
at the post-detection output. This overall bandwidth is equal to the difference
between the low-pass and high-pass 6 dB cutoff frequencies, as measured using
F2.2.a through i below.
F.2.1 (U) Signal Generator Requirements. -- This procedure accounts for the
effect of both the IF and video circuits upon the overall low-pass cutoff
frequencies. An RF sine wave signal generator shall be used for the measurements.
The RF signal generator carrier frequency shall be tunable and shall be within
the tuned frequency range of the detection system. The RF generator carrier
signal shall be amplitude-modulated with a sine wave using any convenient
modulation index (e.g., 20 percent). The modulation index shall be maintained
constant during the measurement, unless otherwise noted. The frequency of
the modulating signal shall be adjustable over the modulating frequency
capability of the RF signal generator. If the maximum usable modulating frequency
is greater than the expected IF bandwidth, then only one RF signal generator
is required. If the expected IF bandwidth is greater than the maximum usable
modulating frequency, then two RF sine wave generators are required for the
test. The second RF generator shall be tunable over the same frequency range
as the first RF generator, but shall not be modulated. When two RF generators
are required, both generators must provide frequency accuracy and resolution
which are at least one order of magnitude better than the expected overall
bandwidth.
F.2.2 (U) Measurement Procedure. -- The overall bandwidth shall be measured
as follows:
a. (U) If one RF signal generator is required, apply the output of the generator
directly to the input of the detection system. If two RF signal generators
are required, apply both generators through a power divider to the input
of the detection system. Inline attenuation (e.g., 20 dB) may be used as
needed to provide signal attenuation and signal generator isolation. Initially,
decrease the output of the second generator (if used) to zero or at least
40 dB below the output of the modulated RF generator.
b. (U) Adjust the carrier frequency of the modulated RF generator around
the tuned center frequency of the detection system until the maximum level
of the modulating signal is observed at the same output port of the detection
system as used during TEMPEST testing. The level of the modulated carrier
signal applied to the detection system and the modulation index must be such
that the detection system output signal is at or below the 1 dB compression
point.
c. (U) Adjust the frequency of the modulating signal until the rnaximum output
level of the detection system is observed or the maximum available modulating
frequency has been reached, whichever comes first. Readjust the RF signal
generator level, if necessary, to maintain the detection system output level
at or below the 1 dB compression point. Note the modulating frequency and
the detection system output level as a reference.
d. (U) Maintaining the same RF generator carrier frequency, as in c
above, reduce the frequency of the modulating signal until the output of
the detection system decreases 6 dB from the reference level noted in
c above or until the modulating frequency is essentially zero frequency
(such as would occur in d.c.coupled Demodulator), whichever comes first.
Record this frequency as the 6 dB high-pass cutoff frequency.
e. (U) Increase the modulating frequency found in step d as necessary
to produce a relatively noise free detection system output signal, but do
not increase the modulating frequency to more than 10 percent of the overall
bandwidth. Note the resulting modulating frequency and the detection system
output level as a reference. Shift the RF carrier frequency down until the
output of the detection system decreases 6 dB from the reference level of
this step. Increase the RF generator carrier level by 6 dB and decrease the
modulation index by 6 dB (e.g., to 15 percent).
f. (U) If only one RF signal generator is required, then increase the frequency
of the modulating signal until the maximum output level of the detection
system is observed. Note the new output reference level. Then, continue to
increase the modulating frequency until the detection system output level
decreases 6 dB from the new reference level. Record the resulting modulating
frequency as the overall 6 dB low-pass frequency.
g. (U) If two RF signal generators are required, set the frequency of the
second generator equal to the first generator, plus the reference modulating
frequency of step e. Turn off the modulation of the first generator.
Increase the level of the second generator until the detection system output
equals the reference level of step c minus 6 dB. Next, increase the
frequency of the second RF generator until the maximum output level of the
detection system is observed. Note this output level as the new reference
level. Then continue to increase the frequency of the second RF generator
until the detection system output level decreases 6 dB from the new reference
level. Record the resulting difference between the two RF generator frequencies
as the overall 6 dB low-pass cutoff frequency.
h. (U) Subtract the result of d (above) from that of f or
g (above) to obtain the overall 6 dB detection system bandwidth.
i. (U) Repeat the bandwidth measurements at a minimum of two tuned frequencies
per decade or one near the center of each tuning band of the detection system,
whichever is the greater number of readings.
F.3. (U) 6 dB Bandwidth Measurements: Tanable Heterodyne or Tunable
Non-Heterodyne Detection System Without Demodulator. -- The bandwidth
of these detection systems shall be mensured as follows:
a. (U) Apply the output of a calibrated unmodulated sine wave
generator1 to the input of the detection system.
b. (U) Adjust the carrier frequency of the cw generator around the center
frequency of the detection systern until the maximum output level of the
detection system is observed at the same port used during TEMPEST testing.
Note the output level.
c. (U) Maintaining the same cw generator carrier amplitude and detection
system tuned center frequency as in b (above), reduce the cw generator
carrier frequency until the output level of the detection system decreases
6 dB from the level obtained in b (above), or until the carrier frequency
is essentially zero frequency (such as would occur at a detection system
output with d.c. response), whichever comes first. Note this frequency.
d. (U) Repeat c (above), except increase the carrier frequency until
the output level decreases 6 dB from the level obtained in b (above).
Note this frequency.
e. (U) Subtract the frequency recorded in c (above) from that in
d (above) to obtain the detection system bandwidth.
f (U) Repeat the bandwidth measurements at a minimum of two frequencies per
decade or one per tuning band (near the center), whichever is the greater
number of readings.
___________________
1 A swept-frequency generator with a constant output voltage may be
used in lieu of the manually-tuned generator. Using a calibrated display
device, the detection system bandwidth can then be read directly.
F.4. (U) 6 dB Bandwidth Measurements: Non-Tunable Detection Systems.
-- The 6 dB bandwidth on non-tunable detection systems shall be measured
in accordance with the procedures specified in Paragraph F.3. The measurement
shall be made on the entire composite detection system, including the
transducer2 (antenna, voltage or current probe, etc.) and display
device (CRO, strip chart recorder, etc.), unless it can be shown that the
bandwidth of these devices will not restrict the bandwidth of the remainder
of the detection system.
_________________
2 The bandwidth of some transducers (e.g., antennas, current probes)
is very difficult or impractical to measure. In these cases, bandwidth
measurements need not be made ou the device, but precautions shall be taken
to assure that lhe device does not limit the overall detection system
bandwidth.
F.5. (U) Impulse Bandwidth Measurements (IBW): Tunable Heterodyne Detection
System with Demodulator. -- The impulse bandwidth of these detection
systems shall be measured as follows:
a. (U) Apply the output of a calibrated AM sine wave generator to the input
of the detection system. The generator output signal shall be amplitude-modulated
30 percent with a sine wave of suitable freauency.
b. (U) Adjust the carrier frequency of the AM sine wave generator around
the center frequency of the detection system until the maximum output level
of the detected signal is observed at the same output port of the detection
system used during TEMPEST testing. Note the output peak-to-peak amplitude
observed on the oscilloscope and the signal level in rms volts of the AM
sine wave applied at the input of the detection system.
c. (U) Disconnect the AM sine wave generator and apply the output of a calibrated
impulse generator to the input of the detection system. Set the IG repetition
rate to any convenient rate less than one-fifth of the nominal overall detection
system bandwidth.
d. (U) Adjust the IG output level so that the peak magnitude of the waveform
displayed on the oscilloscope (at the detection system output) is equal to
one-half the peak-to-peak amplitude of the detected sine wave recorded in
b (above). Note the level in volts (equivalent rms sine wave)/MHz
of the impulsive signal applied at the input of the detection system.
e. (U) Calculate the impulse bandwidth of the detection system with the following
formula:
|
|
0.3 (AM sine wave input signal level in rms volts recorded in b (above).) |
| IBW |
= |
__________________________________________________________________ |
|
|
(impulsive input signal level in volts (equivalent rms sine wave)/MHz, recorded
in d (above).) |
f. (U) Repeat the impulse bandwidth measurements at a minimum of two tuned
frequencies per decade or one per tuning band (near the center), whichever
is the greater number of readings.
F.6. (U) Impulse Bandwidth Measurements: Tunable Heterodyne or Tunable
Non-Heterodyne Detection System Without Demodulator. -- The impulse bandwidth
of these detection systems shall be measured as follows:
a. (U) Apply the output of a calibrated unmodulated sine wave generator to
the input of the detection system.
b. (U) Adjust the carrier frequency of the cw generator around the center
frequency of the detection system until the maximum output level of the detection
system is observed on an oscilloscope at the same port used during TEMPEST
testing. Note the output peak-to-peak amplitude observed on the oscilloscope.
and the signal level in rms volts of the cw sine wave applied at the input
of the detection system.
c. (U) Disconnect the cw generator and apply the output of a calibrated impulse
generator to the input of the detection system. Set the IG repetition rate
to any convenient rate less than one-fifth of the nominal overall detection
system bandwidth.
d (U) Adjust the IG output level so that the peak-to-peak waveform displayed
on the oscilloscope (at the output of the detection system) is equal to the
peak-to-peak amplitude of the cw waveform recorded in b (above). Note
the level (in volts (equivalent rms sine wave)/MHz) of the impulsive signal
applied at the input of the detection system.
e. (U) Calculate the impulse bandwidth of the detection system with the following
formula:
|
|
(Sine wave input signal level in rms volts recorded in b (above).) |
| IBW |
= |
__________________________________________________________________ |
|
|
(impulsive input signal level in volts (equivalent rms sine wave)/MHz, recorded
in d (above).) |
f. (U) Repeat the impulse bandwidth measurements at a minimum of two tuned
frequencies per decade or one per tuning band (near the center), whichever
is the greater number of readings.
F.7. (U) Impulse Bandwidth Measurements: Non-Tunable Detection Systems.
-- The impulse bandwidth shall be measured as follows:
a. (U) Apply the output of a calibrated unmodulated sine wave generator to
the input of the detection system.
b. (U) Adjust the carrier frequency of the cw generator around the center
frequency of the detection system passband.
c (U) Obtain a convenient display of the detection system output signal on
an oscilloscope. Note the output peak-to-peak arnplitude observed on the
oscilloscope and the signal level in rms volts of the cw sine wave applied
at the input of the detection system.
d. (U) Disconnect the cw generator and apply the output of a calibrated impulse
generator to the input of the detection system. Set the IG repetition rate
to any convenient rate less than one-fifth of the nominal overall detection
system bandwidth.
e. (U) Adjust the IG output level so that the peak magnitude of the waveform
displayed on the oscilloscope (at the output of the detection system) is
equal to one-half the peak-to-peak amplitude of the cw waveforrn recorded
in c above. Note the level, in volts (equivalent rms sine wave)/MHz,
of the impulsive signal applied at the input of the detection system.
g. (U) Calculate the impulse bandwidth of the detection system with the following
formula:
|
|
(Sine wave input signal level in rms volts, recorded in c (above).) |
| IBW |
= |
__________________________________________________________________ |
|
|
(impulsive input signal level in volts (equivalent rms sine wave)/MHz, recorded
in d (above).) |
UNCLASSIFIED
[Pages G-1 to G-12]
CONFIDENTIAL
TABLES AND FIGURES
[Full page of two boxes redacted.]
[Full page of two boxes redacted.]
[Half page with one box redacted.]
Note: See Table G-6 for application examples [Note to unknown table.]
[Full page with one box redacted.]
_________________
1 Lowest bit rate as defined in paragraph 3.1.4
2 Refer to Table G-5. [Footnotes to unknown figures.]
[Figure redacted.]
Figure G-1. -- Assumed Transition Time Based on Pulse Width Signaling
Rate (Maximum) (U)
[Figure redacted.]
Figure G-2. -- Bounds on Tunable Overall Detection System Bandwidth
(U)
[Figure redacted.]
Figure G-3. -- Maximum Permissible Tunable Starting Test Frequency (U)
Note: This figure is equivalent to Figure 10-1.
UNCLASSIFIED
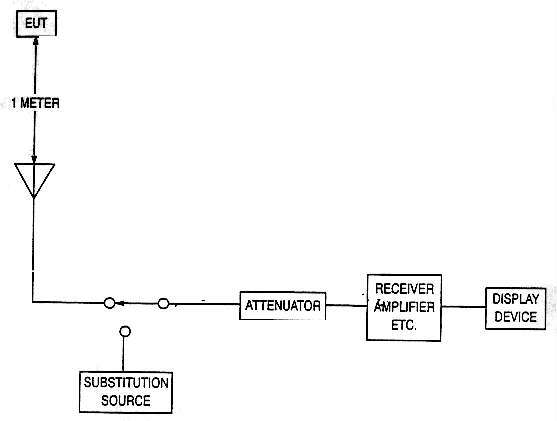
Figure G-4. -- Typical Test Instrumentation for ER Tests (U)
Note: This figure is equivalent to Figure 10-2.
UNCLASSIFIED
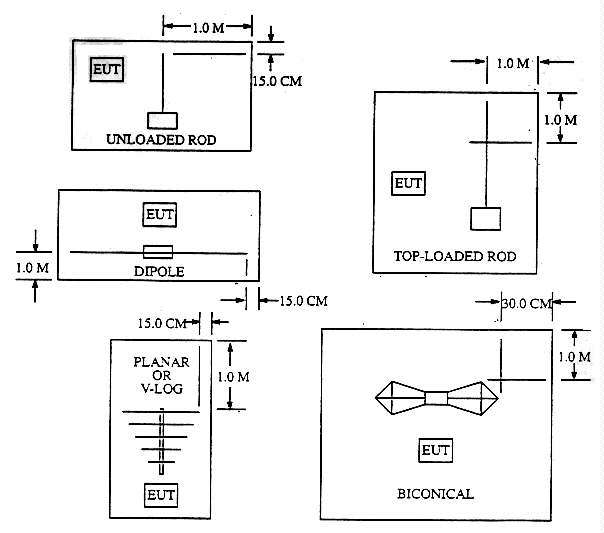
Figure G-5. -- Required Minimum Antenna Distances From Metal Surfaces
and Objects Other Than the EUT (U)
[Page G-12 - Full page redacted.]
CONFIDENTIAL
[Pages H-1 to H-18]
UNCLASSIFIED
LEVEL I
LIMITS
[All pages redacted.]
UNCLASSIFIED
[Pages I-1 to I-8]
UNCLASSIFIED
LEVEL II
LIMITS
[All pages redacted.]
UNCLASSIFIED
[Pages J-1 to J-4]
UNCLASSIFIED
LEVEL III
LIMITS
[All pages redacted.]
UNCLASSIFIED
[Pages K-1 to K-2]
UNCLASSIFIED
IMPULSE GENERATOR CALIBRATION
K.1. (U) Procedure. -- Impulse generators shall be calibrated by one
of the four following methods:1
___________________
1 Other methods may be used if justified and approved by the sponsoring
organization.
K.1.1 (U) Method 1.
a. (U) Apply the output of the impulse generator to be calibrated to the
input of an amplitude-linear receiver having synchronously tuned, less-than
critically-coupled, circuits. Radio interference field intensity receivers
are satisfactory for this purpose if their impulse bandwidth is`at least
five times the repetition rate of the impulse generator. Any automatic gain
control (AGC) system shall be defeated. Once the receiver controls are set,
they should not be changed during the calibration process.
b. (U) Obtain an oscilloscope pattern of the overall receiver response at
the IF output. The oscilloscope controls shall be so adjusted that the pattern
is as large as possible within the calibrated area on the face plate. Either
photograph or trace the pattern. Record the oscilloscope sweep speed setting.
(The sweep speed shall be calibrated accurately.)
c. (U) Use a planimeter or other integrating device to determine the area
of the positive portion of the major lobe of the response waveform. (More
accuracy can be obtained by summing the area under the odd-numbered lobes
and subtracting from it the total area under the even-numbered lobes.) This
operation shall be carried out at least five times and the average of the
readings taken as the area.
d. (U) Calculate the impulse bandwidth of the receiver in accordance with
the following formula:
|
|
pattern height* in cm |
|
| IBW in MHz |
= |
_____________________________________ |
X 10-6 |
|
|
(pattern area* in cm2 (sweep speed in sec/cm) |
|
*Refers only to positive portion of response waveform.
e. (U) Connect a calibrated sine wave generator to the receiver. Tune the
generator to the receiver's tuned frequency and adjust the output until the
peak pattern height is the same as that obtained with the impulse generator
in a. and b. (above). Record the output of the sine v;ave generator
in microvolts (rms).
f. (U) Calculate 20log10(e/d) where e and d are the
results obtained in e. and d. (above) expressed in microvolts
(rms) and megahertz, respectively. This calculation gives the spectral intensity
of the impulse generator output in dB,µV/MHz (equivalent rms
sine wave).
K.1.2 (U) Method 2.
a. (U) Select a bandpass or low-pass filter with the following characteristics:
(1) (U) Minimum upper roll-off of 18 dB/octave.
(2) (U) Maximum upper 3 dB cutoff point which is 10% of the reciprocal of
the expected width of the driving impulse (from the IG to be calibrated)
or 80% of the bandpass of the CRO in use, whichever is less.
(3) (U) Passband wide enough to permit passage of sufficient energy such
that the peak voltage of the output waveform can be accurately read on the
CRO.
(4) (U) 50 ohm input and output impedance in the passband.
b. (U) Determine thc impulse bandwidth (IBW) of the filter empioying the
procedures specified in method 1, paragraphs a. through d.
(above), substituting the word "filter" for "receiver". Once the IBW of the
filter has becn measured, the filter may be used to calibrate any number
of IGs; however, the IBW shall be rechecked in accordance with the calibration
requirements specified in Paragraph 7.6.
c. (U) Terrninate the output of the IG to be calibrated with a 6 dB (minimum),
50 ohm pad and connect it to the input of the filter.
d. (U) Terminate the output of the filter with a 50 ohm resistive load and
connect it to the vertical input of the CRO.
e. (U) Record the peak voltage of the filter output on the CRO microvolts.
f. (U) Calculate:
20log10(e/b) + pad loss - 3 dB + filter insertion loss
where e and b are the results obtained in paragraphs e. and b.
(above), expressed in microvolts (peak) and megahertz respectively. This
calculation gives the spectral intensity of the impulse generator output
in dB,µV/MHz (equivalent rms sine wave).
K.1.3 (U) Method 3. -- Compare the output of the IG to be calibrated, with
the output of another IG which has previously been calibrated, in accordance
with method 1 or method 2, within the last six months.
K.1.4 (U) Method 4.
a. (U) Apply the output of the impulse generator to be calibrated to the
input of a spectrum analyzer having the following characterstics:
(1) (U) Known impulse bandwidths.
(2) (U) Absolute amplitude accuracy equal to +/-2 dB or better.
b. (U) Select a spectrum analyzer bandwidth at least five times the repetiton
rate of the impulse generator, but no larger than one-tenth the usable spectrum
of the impulse generator. Select a scan time in seconds/division, no less
than 10/repetition rate (Hz) to insure ten-impulse responses per division.
c. (U) Add any conversion factors to the spectrum analyzer displayed voltage
needed to convert dBm to dB ref. 1 µV rms. Subtract the impulse
bandwidth of the spectrum analyzer in dB ref. 1 MHz from this value to convert
to dB ref. 1 µV/MHz and subtract 3 dB to convert the reading
to dBµV/MHz (equivalent rms sine wave), which is the spectral
intensity of the impulse generator output.
UNCLASSIFIED
[Pages L-1 to L-10]
UNCLASSIFIED
APPENDIX L
TEMPEST TEST PLAN OUTLINE
[Page L-2] THIS PAGE IS INTENTIONALLY BLANK
SAMPLE TABLE OF CONTENTS
Abstract
1 .0 Introduction
2.0 Equipment Under Test
2.1. Description of EUT
2.2. Theory of Operation
2.2.1, 2.2.2, 2.2.3, etc: Function of Each Box, as required
2.3. Operating Modes
3.0 RED Signals
3.1. RED Signal Description
3.2. RED Signal Flow diagram
4.0 RED and Black I/O Lines
5.0 Potential Carriers
6.0 TEMPEST Test Requirements
6.1. Test Procedures
6.2. Documentation
6.3. Test Media
6.4. RED Signals and Test Categories
6.5. Frequency Ranges
6.6. Bandwidth/Bandpass Selections
6.7. Exercise Equipment and Modes of Operation
6.8. Test Set-Ups
6.9. Monitor Signals
6.10. Test Messages
6.11. Predicted Detected Output Signals
6.12. Test Matrix
7.0 Test Capabilities
7.1. Test Facilities
7. 2. Instrumentation
7.3. Personnel Qualifications
Figures
2-1. Functional Block Diagram
2-2. System Block Diagram
2-3., etc. Additional Block Diagrams, if required
3-1. Time-Sequence RED Signal Flow Diagram, Simplified
4-1. Input/Output Lines
6-1. Exercise Equipment, Diagram
6-2. Synchronize/Monitor Test Points
6-3. Predicted/Detected Output Signal Displays
6-4. Documentation, examples
6-5. Test Setup
6-6., 6-7., etc: Other Test Setups, if required
7-1. Shielded Enclosure(s)
7-2. Certification: Test Facility
7-3. Certification: Instrumentation
Tables
6-1.-Test Matrix
7- 1. Instrumentation
[Page L-4] THIS PAGE IS INTENTIONALLY BLANK
OUTLINE DESCRIPTION (U)
Abstract (150 to 300 words)
-
Identification of equipment or system
-
Purpose of test, including dates
-
Location of test facilities
-
Functioning/operating principles
-
RED data and lines identification
-
Certifications included for Facility and Measurement Equipment
-
Test setup including exercise and simulation equipment
-
Commercial-concluding statement
1.0 (U) Introduction.
1.1. (U) Introductory statement, including exact identification of EUT: name
and type number; purpose of test; contractual and subcontract information,
if any; brief statement of configuration or modes of operation selected for
testing and for certification, if applicable; any other statements necessary
to round out the introduction for the reviewer, as well as for the technician
who will be following this test plan and performing the actual TEMPEST test.
1.2. (U) Include a list of all applicable documents such as NSTISSAM
TEMPEST/1-91.
1.3. (U) Provide details of any waivers or exceptions, and justify.
2.0 (U) Equipment under Test. -- This section of the test plan describes
the EUT in precise and definitive terms.
2.1. (U) Description of tbe EUT. -- This should include nomenclature,
description of intended uses including actual applications as a system, as
part of a system, or as a stand-alone, modes of operation, modes to be tested,
power, I/O lines, etc.
2.2. (U) Theory of Operation. -- This should be in sufficient detail
or depth to provide the U.S. Government reviewer and the person performing
the TEMPEST tests with the knowledge to ascertain whether the test plan exploits
all TEMPEST modes and conditions. Identify control and timing signals that
are associated with processing of RED data.
(Figure 2-1. -- Functional Block Diagram)
(Figure 2-2. -- System Block Diagram if applicable, to identify or clarify
the position of the EUT in an operational system.)
2.2.1 (U) Function. -- If the device or system eonsists of more than one
box, separate paragraphs may be used to describe the functions of each (2.2.2,
2.2.3, etc.). Use either a separate block diagram for each box or a consolidated
single diagram.
2.3. (U) Operating Modes. -- Describe each mode of operation, e.g.,
manual, automatic, single channel, TDM, orderwire, ete.
3.0 (U) RED Signals. -- In this section, identify each EUT RED signal
type, the major internal and external RED signal sources (S1, S2, S3, etc.)
for each RED signal type, and all RED signaling rates (Rd1, Rd2, Rd3, Rt1,
Rt2, Rt3, etc.). lt shall be considered a different RED signal type if there
is a change in format, code, timing, transfer method, or parity. Determine
the applicable test categories for each Rd and Rt. A time-sequence description
and illustration of the RED signal flow shall be provided to properly identify
all RED signal sources.
3.1. (U) RED Signal Description.
This section should present signal description in tabular form, including:
-
RED signal identification including frequency
-
Parity and other nondata information
-
Level, e.g., voltage, impedance, TTL, 188, etc.
-
Sampling information, if applicable
-
Serial, parallel, MUX, etc.
3.2. (U) RED Signal Flow Diagram. -- Figure L-1 presents an example
of a time-sequence RED signal flow diagram. It is recommended that each RED
signal be identified with consecutive mgmbers or letters, and that the same
identification be used throughout the test plan and test report.
4.0 (U) RED and BLACK I/O Lines. -- This section enumertes all lines
that connect to the EUT. Identify each RED line and each BLACK line that
enters or leaves the EUT or the EUT area. Select and justify specific
lines to be tested. Justify rejection of lines not to be tested. This
should include signal lines, control lines, clocks, grounds, status lines,
and others. (Figure 4-1. -- Input/Output Lines -- This should be a block
diagram that differs from the functional block diagram of Figure 2-1 since
it permits each line that interconnects EUT boxes or enters/leaves the EUT
area to be shown and identified. Identification of each line should be clear
and complete, including information on function, time, format, level,
destination, and any other pertinent features.)
5.0 (U) Potential Carriers. -- Identify potential inadvertent carriers
of RED information including possible areas where contamination with RED
information may occur. An example could be clock harmonics, or any clock
multiples or submultiples that provide timing informnation to more than one
circuit or function. The TEMPEST test plan should point the way to search
and verification by its thoroughness in listing all such potential carriers.
6.0 (U) TEMPEST Test Requirements. -- This section should include
all details of the planned TEMPEST test, except for preliminary information
in the preceding sections. The use of tables, as applicable, will be fully
acceptable, with accompanying explanations as needed.
6.1. (U) Test Procedures. -- Provide a narrative description of both
general and specific test procedures. Describe in general the procedures
for running the tests and the process of operating the detection system to
acquire and measure emanations. Include specific operation of the EUT and
exerciser. The procedures for running the tests should be presented in the
form of a specific guide for the TEMPEST test technician, including necessary
adjustments for each operational mode to be explored. Include herein any
special conditions to be observed and any specific software requirements
to attain desired operational characteristics.
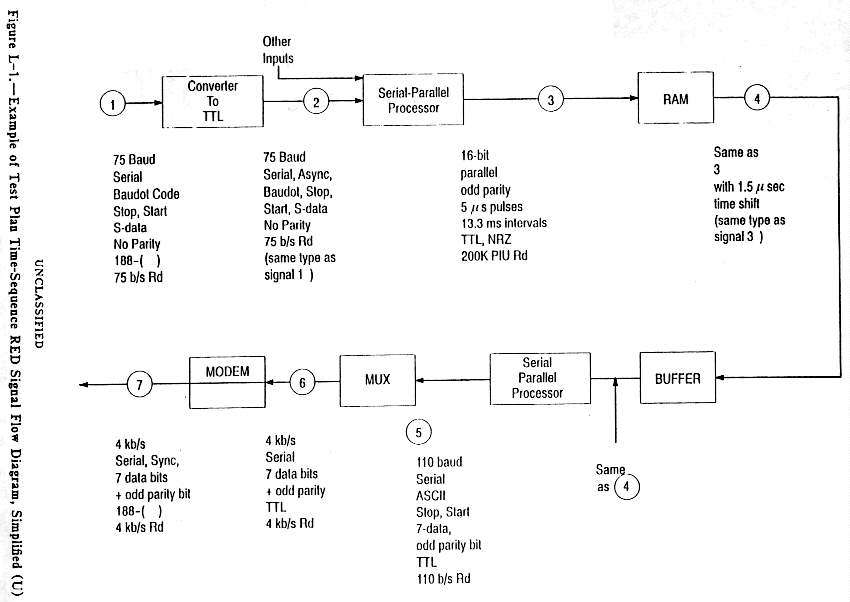
Figure L-1. -- Example of Test Plan Time-Sequence RED Signal Flow diagram,
Simplified (U)
6.2. (U) Documentation. -- Describe herein accessory equipment used
for documentation, such as camera, chart recorder, etc. Include examples
of data sheets used for manual recording of raw data for each test and for
correcting, adjusting, and normalizing results. Attach examples of type/s
of data sheets to be used. (Figure 6-4. -- Example(s) of Documentation Forms)
6.3. (U) Test Media. -- List the various media in which tests are
to be performed including ER, MR, PLC, etc. (as well as tunable and non-tunable).
Include each signal line, control line, clock line, powerline, exc., to be
tested. Exceptions, deletions, limitations, or modifications will require
rationale and authority from the sponsoring organization for each change.
6.4. (U) RED Signals and Test Categories. -- From the RED signal sources
identified in Paragraph 3.0, select those RED signals/sources to be investigated
as part of this TEMPEST test. Justify those not selected for testing. Select
the appropriate test category for each RED signal source.
6.5. (U) Frequency Ranges. -- Include a narrative justifying selection
of appropriate frequency ranges for both tunable and non-tunable tests.
6.6. (U) Bandwidth/Bandpass Selections. -- Explain selections of
bandwidths and bandpasses for tunable and non-tunable tests. State the bandwidth
limitations, if any, of the instrumentation.
6.7. (U) Exercise Equipmeut and Modes of Operation. -- Describe the
equipment and system to be used to exercise the EUT. Present the rationale
for selection of this equipment and this test system. Include explanation
why certain modes, if any, were selected for test exercise and why other
modes of operation, if any, were excluded from such testing. Describe the
physical location of the exercise equipment. Describe use of any special
operating techniques, e.g., use of software to exercise certain portions
of the EUT.
(Figure 6-1.-Exercise Equipment, Diagram)
6.8. (U) Test Setups.
6.8.1 (U) Clearly describe and diagram the test setup(s) to be used for text
media examinations (ER, MR, BLC, PLC, and RLC). Generally, only one dlagram
will be needed; however, additional diagrams rnay be necessary for clarity.
Include the test environment or shielded test enclosure, EUT, auxilary equipment,
exercise equipment, power supplies, blocks, detection and measurement equipment,
oscilloscopes, PLISN's, filters, EUT ground planes, grounds, etc. Specify
EUT grounding methods for both signal and safety. Also, specify how the cabinet
is connected in the grounding scheme. The description and diagram should
make clear what is to be in the test enclosure(s), what is to be placed in
any auxiliary shielded enclosure(s), and what is to be placed or used outside
shielded enclosures. Provide justification if the type and installation of
conduits and cables used in the EUT test setup are not the same as those
specified for the actual operational installation.
6.8.2 (U) If the equipment or system can or may be operated in more than
one mode or more than one configuration, list and describe all such variations.
If applicable, explain why certain modes are selected and why others are
not to be tested. This explanation should tie in with the intent of this
test and thus with the EUT description in Paragraphs 1.0 and 2.1 of this
test plan. Accordingly, TEMPEST accreditation, as a result of the test to
be performed, will not include the equipment or system in the modes or
configurations excluded in this test plan, unless due justification is provided
herein.
(Figure 6-5, and, if required, 6-6, 6-7, etc.: Test Setup)
6.9. (U) Monitor Signals. -- Explain and diagram specifically how
and where monitor and/or synchronization signals are to be derived for the
purpose of comparing or correlating detected emanations with RED signals
in Paragraph 3.0 of this test plan. Describe what precautions will be taken
to preclude signal distortions and false indications of detected emanations.
(Figure 6-2. -- Synchronize/Monitor Test Points)
6.10. (U) Test Messages.
6.10.1 (U) Select test messages, words, characters, or input states which
will succeed in running the EUT through all combinations of conditions
representative of all operational usages. Test messages should also be selected
or designed to aid in rapid correlation of detected ernanations by assuring
a high degree of recognition or identification.
6.10.2 (U) Present in this section all the actual test messages to be used
for testing, and include rationale for selections made.
6.11. (U) Predicted Detected Output Signals. -- Include explanation
of hypothetical detected compromising ernanations. These should relate directly
to the test messages described in Paragraph 6.10 above.
(Figure 6-3. -- Predicted Detected Output Signals)
6.12. (U) Test Matrix. -- This section should gather together in a
single table, as a ready reference, all information required to perform all
TEMPEST tests.
(Table 6-1: Test Matrix. See example in Table L-1).
TABLE L-1
EXAMPLE OF TEST MATRIX (U)
|
Your
Test |
Spec. |
EUT |
S* |
Rd |
Cat. |
Test
Medium |
Test
Type |
Freq.
Range |
Bandwidth |
Rcvr |
Ampl |
Filter |
Ant |
Approx.
Test
Schedule |
| ______________________________________________________________________________________________ |
| 1AA-1 |
1-91 |
etc |
S1 |
xkb/s |
X |
ER |
TUN |
1-10MHz |
.25MHz |
etc |
etc |
|
|
6/16/91 |
| 1AA-2 |
1-91 |
etc |
S1 |
xkb/s |
X |
ER |
TUN |
1-100M |
1M |
|
|
|
|
6/16/91 |
| 1AA-3 |
1-91 |
etc |
S1 |
xkb/s |
X |
ER |
TUN |
100-1000M |
5M |
|
|
|
|
6/16/91 |
| 1AA-4 |
1-91 |
etc |
S1 |
xkb/s |
X |
ER |
TUN |
1-10GHz |
5M |
|
|
|
|
6/16/91 |
| 2AA-1 |
1-91 |
etc |
S2 |
xkHz |
Z |
ER |
TUN |
3-30MHz |
etc |
|
|
|
|
6/16/91 |
| 2AA-2 |
1-91 |
etc |
S2 |
xkHz |
Z |
ER |
TUN |
30-300M |
|
|
|
|
|
6/16/91 |
|
|
|
|
|
|
|
|
|
|
|
|
|
|
|
| Notes:
1. Detailed breakdown in this table may be simplified if these details have
been provided in test tables.
2. Numbering schemc shown in column 1 is only an example. Whatever scheme
is selected should be consistent and clear throughout the test plan and the
TEMPEST test including data sheets and the test report.
S* -- RED signal source description
e.g.:
S1 = parallel I/O
S2 = printer data
S3 = RAM-UART
S4 = CPU-RAM
S5 = etc.
|
|
7.0 (U) Test Capabilities. -- This is the section for reporting on
facilities to be employed in the projected TEMPEST testing, if not covered
in a separate facilities certification report.
7.1. (U) Test Facilities.
7.1.1 (U) Describe facilities to be used in the planned test, including
dimensions, type of construction, shielding materials, panel seam scheme,
attenuation, door(s), lighting, air-conditioning, air ducts, powerline filtering,
power entrance, signal entrance scheme, grounding details, use of companion
room(s) for test equipment and/or exercise equipment.
(Figure 7-1.-Shielded Enclosure(s))
7.1.2 (U) If not covered in a separate certification report, include herein
as Figure 7-2, certification attesting to test facility in accordance with
Paragraph 6.5 of this document.
7.2. (U) Instrumentation.
7.2.l (U) Describe measurement cquipment, including detection cquipment,
antennas, attenuators, oscilloscopes, power supplies, filters, PLISN's, signal
generators, IG's, probes, etc., if not covered in a separate detection system
certification report.
(Table 7-l: Instrumentation)
7.2.2 (U) Include manufacturer, type number, description, frequency range,
categories covered, bandwidths, etc., as applicable.
7.2.3 (U) If not covered in a separate certification report, include herein,
as Figure 7-3, detailed certification attesting to last calibration of
frequencies, sensitivity, etc., in accordance with Paragraph 6.4 of this
document.
7.3. (U) Personnel Qualifications. -- Provide qualifications of
supervisory and tcchnical personnel who prepared this test plan, as well
as those who will perform the tests and those who will write thc TEMPEST
evaluation report.
UNCLASSIFIED
[Pages M-1 to M-3]
UNCLASSIFIED
INSTRUCTIONS FOR COMPLETING
TEMPEST PROFILE FORM
| ACCESSION NUMBER |
Leave blank, number assigned by the NTIC. |
| CLASSIFICATION |
Fill in classification of profile. |
ORIGINATING SERVICE
OR AGENCY |
Fill in the name and address of service or agency that
is paying for the test or originated test tasking. |
ORIGINATOR'S ID NO./
PROJECT NO. |
Number assigned by testing organization to this project. Enter task number
or report number. |
| CONTRACT NUMBER |
Enter contract number if applicable. |
| TYPE |
Enter X in the appropriate line: Lab, Fielded, or Study. |
| TESTING ORGANIZATION |
Enter name and address of testing organization. |
| TEST STANDARD |
Enter test standard(s) applicable to equipment. |
| DATES OF TEST |
Enter dates equipment was under test (from - to). |
| REPORT T1TLE |
Enter official title of report as it appears on the front cover. |
| REPORT DATE |
Enter date of the report as it appears on the front cover. |
| DISTRIBUTION CODE |
Enter X in the appropriate line. If report is limited, and cannot be
released to the entire TAG Community, attach explanation. |
| ABSTRACT |
Brief description of the report. |
| OBJECTIVES |
Enter X in the appropriate line. |
| EUT DESCRIPTION |
Brief description of equipment under test; to include:
MODEL NUMBER Enter model number.
MANUFACTURER (no abbreviations)
EQUIPMENT NAME Enter other names equipment is known by (e.g., LaserJet Series
III, SPARCStation, SCOPE etc., do not enter the model number here).
EQUIPMENT CATEGORY (see NTIC's TEMPEST Zone Assignments publication.
EQUIPMENT COMMENTS List any options or equipment tested with the equipment
(e.g., tested with a Zenith ZCM-1492 monitor). |
| RESULTS |
Enter NSTISSAM TEMPEST Level and enter X in the appropriate compliant
box.
Enter Zone Rating as: A-D, B-D, C-D, or D
Enter Walk-Away Distance (if applicable).
Enter Comments about the Results. |
______________
NTIC NUMBER |
TEMPEST Profile
|
________________
CLASSIFICATION |
|
Originating Service
or Agency |
Orig. ID No./Project No.
|
Type
Laboratory _________
Field _________
Study _________ |
| Contract No. |
Testing Organization
|
Test Standard
|
Dates of Test
|
Report Title
|
Report Date
|
Dist. Code
All TAG _________
Limitred _________ |
ABSTRACT |
|
OBJECTIVES |
NSTISSAM TEMPEST/1-92 Compliance
Evaluation______________
TEMPEST Zone Evaluation__________________________________ |
EUT DESCRIPTION |
Model No. _________________ Manufacturer
_________________
Equipment Name __________________________________________
Equipment Category _______________________________________
Equipment Comments:
|
RESULTS |
| NSTISSAM TEMPEST Level ________ Compliant: Yes ___ No:
___
Zone Rating: __________ Walk-Away Distance: __________
Result Comments:
|
[Form]
UNCLASSIFIED
(when blank)
_________________
CLASSIFICATION
COMMENT FORM
for
Use one form per comment,
Return completed form to:
Director
National Security Asency
ATTN: C9
Fort George G. Meade, Maryland 20755-6000
1. Date:
2 Name of Contributor:
3. Name of Organization:
4 Address of Organization:
5. Reference section in document (paragraph. page number, line number if
required; if general comment describe subject to be discussed):
6. Comment (What should be changed?):
7. Alternative (What should it be changed to?):
8. Rationale (why should change be made?):
If more space is required for any of the above items, use extra sheet(s)
and attach to this form.
UNCLASSIFIED
(when blank)
[Rear Cover]
CONFIDENTIAL
NSTISSAM TEMPEST/1-92
CONFIDENTIAL
[Two pages] Distribution
List (Separate file)
End of document.
Transcription and HTML by Cryptome.